
Summary
I started this program when a buddy explained what he did in paintless dent repair. He looked at a CSV file from the National Weather Service concerning severe weather. If the reported hail size was large enough, but not too large to cause the vehicle to be classified a total loss, then he would go to that location to write estimates which his company would then repair. This company works with already established body shops.
I thought there had to be a better way. His boss paid hundreds per month for targeted weather information. In the research process, I discovered that the data his boss paid for was free, just stored on Amazon Web Services in a fairly inaccessible format. All the company did was package it in a user-friendly way.
I used census data and weather information to create a web application that overlays hail locations on a map with vehicle ownership density, per capita income, median income, and population density as layers. For each hail strike, images from the nearest Doppler radar are downloaded, which can be run as a time loop or advanced one slide at a time.
Link to GitHub: https://github.com/hkefalas/hail-risk-dashboard
Data Collection
I collected data from the Census Department and the National Weather Service.
Using the Census API, I downloaded income, vehicle ownership, and population data by census tract for the region consisting of Missouri, Nebraska, Iowa, and Kansas.
To create the density, I divided the population and vehicle ownership by the area of the census tract. Census tracts are small subdivisions with average populations of about 4,000, within a larger county structure. Tract boundaries follow features like roads, rivers, or city lines, but are more stable than other small areas, allowing for better trend tracking over time.
The densities are shaded on the map based on their weight.
The National Weather Service publishes a daily significant weather report. This is the primary source for knowing when and where hail struck and the size of the hail. The source of the data – radar or actual observation – is also included. Each day is stored so multiple days of data can be displayed.
Using the latitude and longitude from the hail report, the closest Doppler station to the hail strike is identified. Then the Doppler images plus or minus two hours from the hail strike are downloaded from the AWS Bucket.
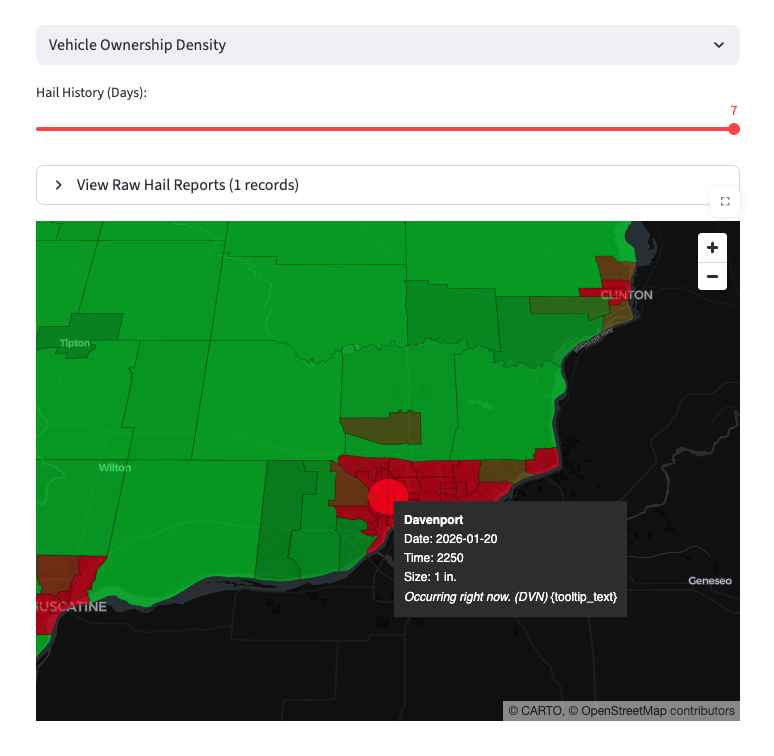
This is a sample strike in Davenport, Iowa. Hovering over the strike shows the tooltip displays the date, time, and size of the hail. It also includes any notes from the weather report. From the drop-down menu, vehicle ownership density has been selected.
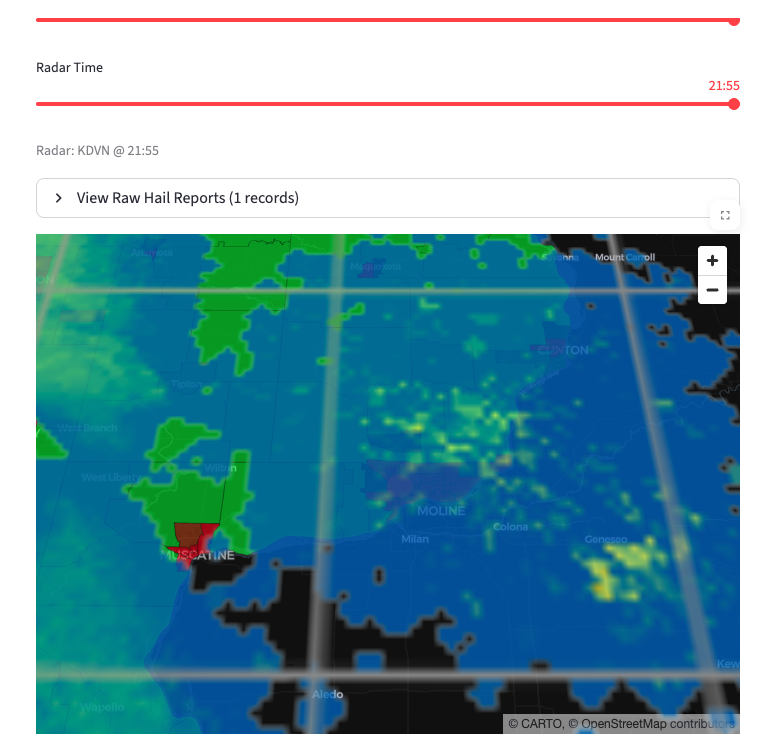
Sample Doppler image. The slider at the top can be used to play the four hours on loop or display them one image at a time. The time between images is set by the National Weather Service based on the storm severity.
Further Development
Using historical data from a paintless dent repair company, create a hail-risk score that identifies factors correlated with high-revenue hail events. This score enables personnel to be allocated to higher-revenue areas. I assume population density, vehicle ownership, and per-capita income are positively correlated with hail repair revenue.
Incorporate Google Maps information via API to identify body shops within a certain radius of the hail report and place them on a map, or generate a document with their contact information.
Add CoCoRaHS (Community Collaborative Rain, Hail & Snow Network) data to the hail strike data collection.
Get feedback from an end user and improve the interface.