Research Question
Which model best predicts household power consumption? ARMA, VARMAX, Sequential Recurrent Neural Network, and Temporal Convolutional Network will be compared using mean squared error.
Data Description
Energy data (from uci machine learning repository)
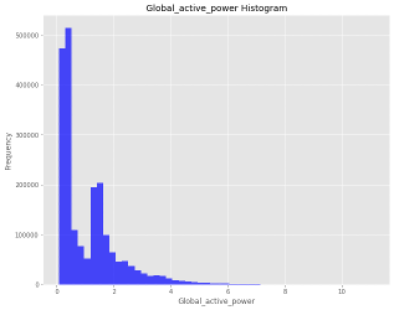
47 months of data from a house in Sceaux, France. Minute-by-minute power usage, broken down into three sub-categories representing the kitchen, laundry room, and AC/water heater.
weather data (from open-meteo.com)
Hourly data over the same 47-month time period, including temperature, relative humidity, apparent temperature, precipitation, rain, snowfall, and weather code.
Missing Data
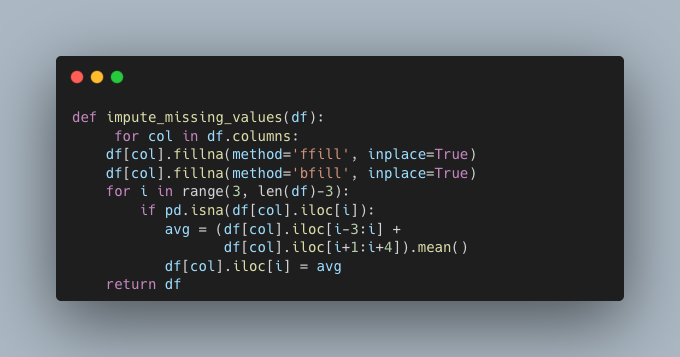
The weather data was complete. Energy data was missing 1.25% (25,979 out of 2,075,259 entries). I imputed the missing values by averaging the three instances before and the three instances after.
Descriptive Statistics
energy

temperature
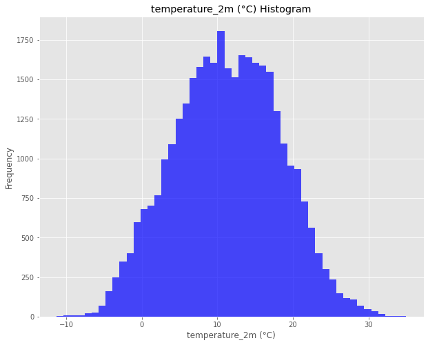
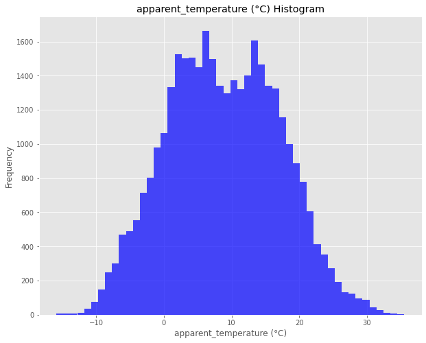
It is interesting to see the subtle difference between actual and apparent temperature.
Data Preparation
Converted DateTime columns to DateTimeType
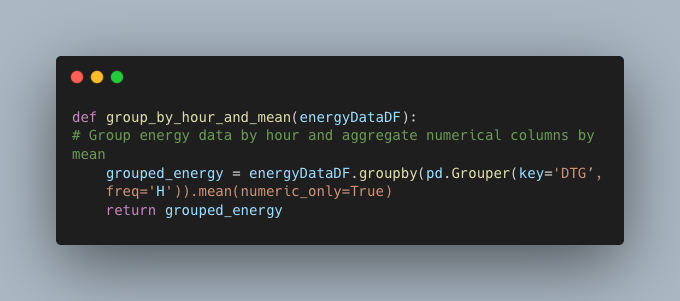
Energy data was every minute, but the weather data was only hourly. I grouped the energy by hour, using the average, and then joined the two dataframes.
Correlation Matrix (Heatmap)
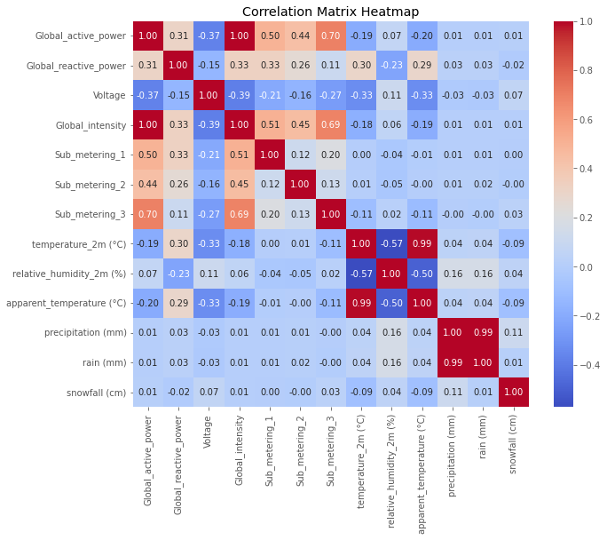
From this heatmap, we can see there are some factors that are correlated, which is good for further exploration.
Time Series Analysis
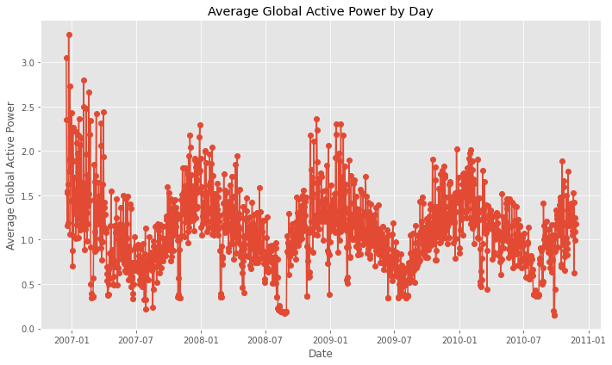
Checking for stationarity.
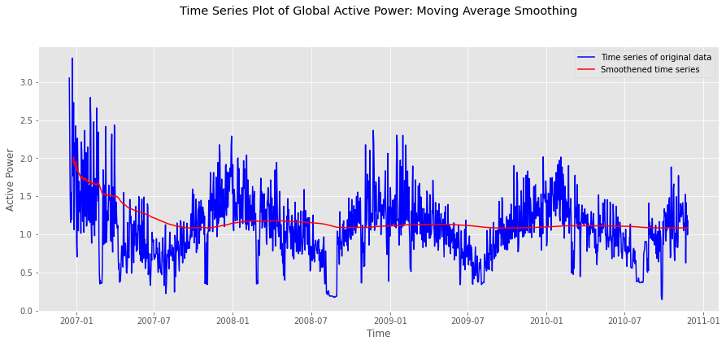
Because the mean decreases and maintains the same value, the data has stationarity.
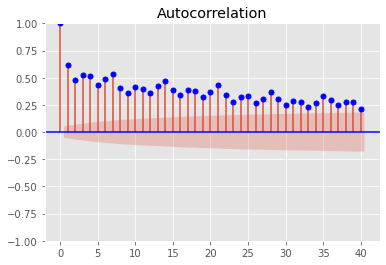
Shows a slight downward trend with seasonality.
The Augmented Dickey-Fuller test results: ADF Statistic: -3.734758680846047, p-value: 0.0036499731073693416. Therefore, we reject the null hypothesis, and the time series data is stationary.
Model Selection
Data Preparation for ARMA, VARMAX, RNN
Scaled the numerical data using MinMax. Encoded categorical variables using LabelEncoder. The first 80% of the data was used for training. The remaining 20% was for testing.
ARMA Model
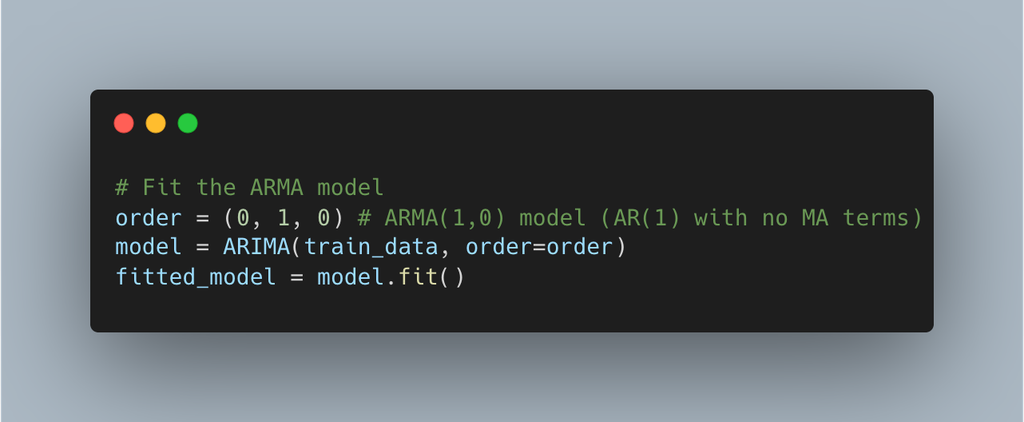
Mean Squared Error: 0.23110142261931224
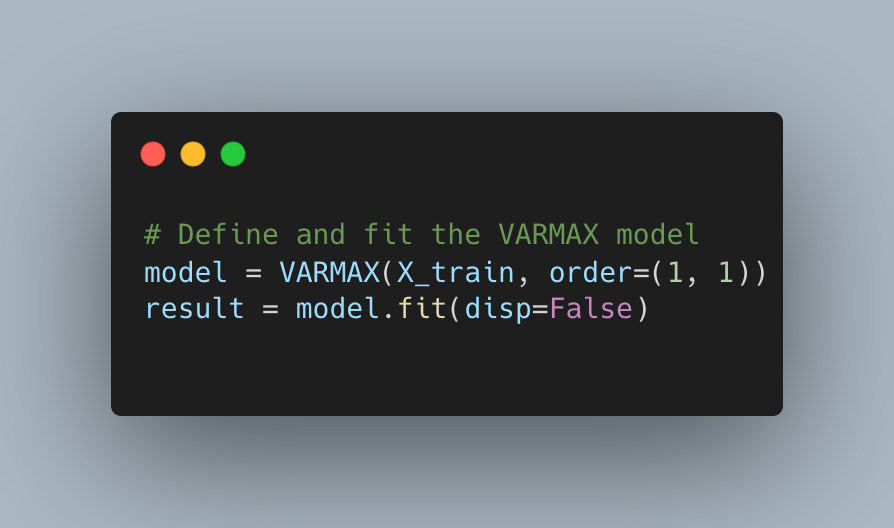
Mean Squared Error: 0.21638903743671925
Sequential RNN Model
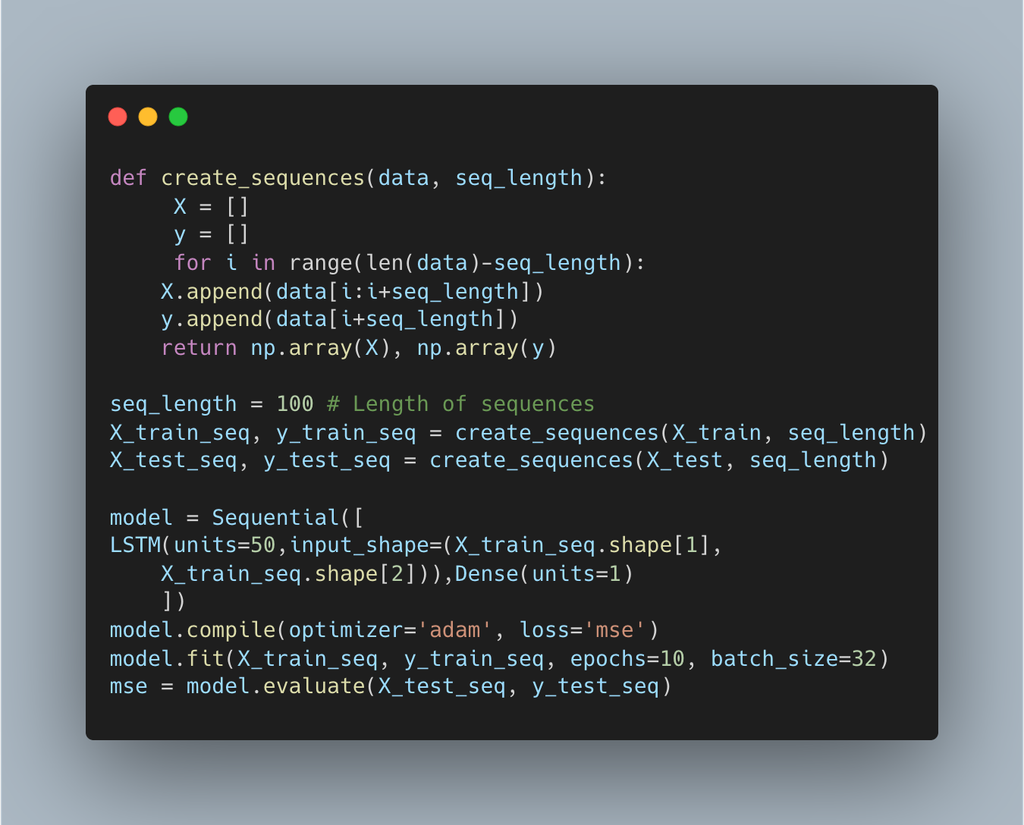
Mean Squared Error: 0.42370715737342834
TCN model
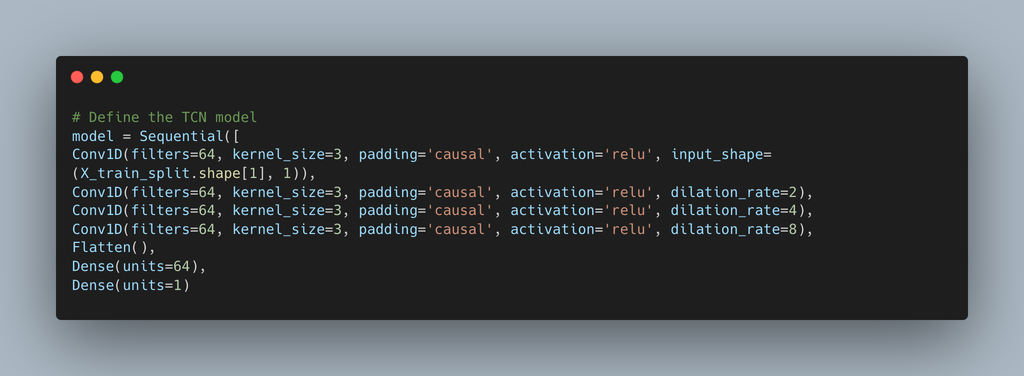
Mean Squared Error: 0.0006787514194050181
Obviously the TCN Model outperformed the others. Tried some hyperparameter tuning on the test data:
- Kernel Size 1 0.0026199349393162537
- Initial Model 0.0026863403666210974
- Dilation +2 0.003402693311389526
- Three Layers 0.004478018530124211
- Kernel Size 6 0.004480887700474159
- Five Layers 0.004730215657512877
- Half Filters 0.004997035454971652
- Double Filters 0.0057001475564108246
Results
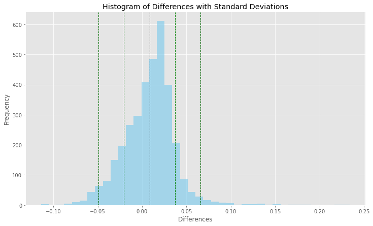
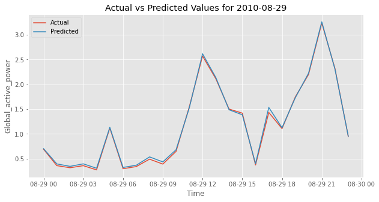
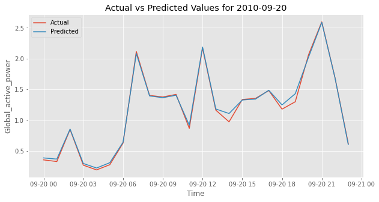
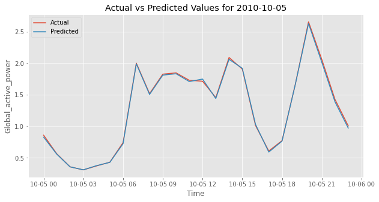
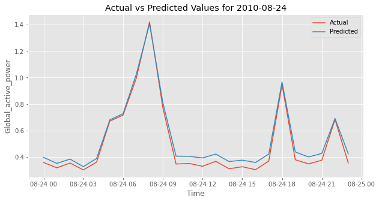
The model predicts higher use most of the time (2292 over to 1167 under). 94.87% of the difference between predicted and actual are within two standard deviations of the mean.
Limitations / Implications
The energy use was from one house in an affluent region of France. Is it representative of the greater population? How many people lived in the house? Were they aware that their energy usage was being tracked? If so, what impact did that knowledge have on their activities? (Hawthorne effect)
This model requires hourly energy usage. Could it work for daily usage? Would it scale to whole neighborhoods?
Could this model be fed weather forecasts, with their uncertainty, and predict future energy demand?